One of the most difficult things to determine during a traffic impact study is the automobile occupancy of cars driven by department store shoppers, and the amount of time that consumers remain inside a store, shopping.
We were requested to provide those types of metrics for five free-standing department stores comprising 200,000 sq ft to 300,000 sq ft of floor area in the following locations:
- Charlotte, North Carolina
- Round Rock, Texas
- Boling Brook, Illinois
- Emeryville, California
- Centennial, Colorado
Our traffic studies – parking turnover and vehicle occupancy – were conducted on a Friday, Saturday, and Sunday, from 10 AM to 9 PM during January and February, 2016. We utilized Optical Character Recognition (OCR) software to determine license plate numbers and then match the plate numbers for vehicles entering and exiting the parking lots or garages.
Even though all the stores were the same brand – only the store sizes varied – we found it interesting how the average duration of the customer changed so dramatically from day to day.
Table 1 shows a comparison of all five stores on a Friday, showing the average duration from 74 to 79 minutes.
Table 1
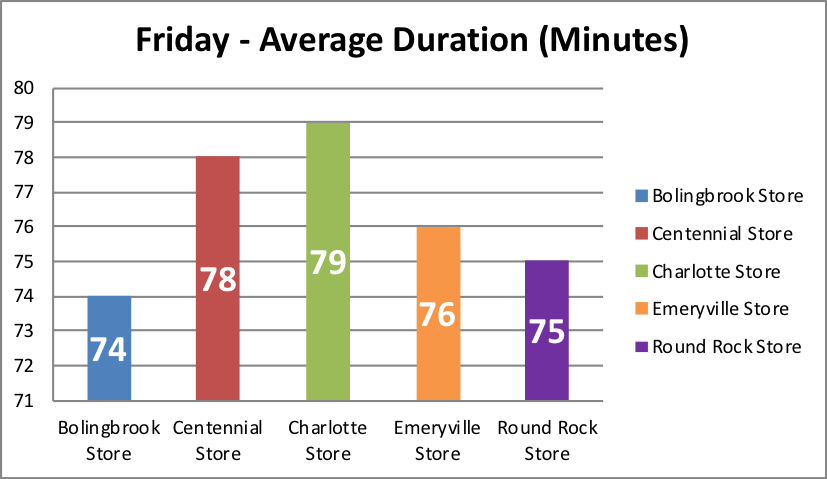
Table 2 shows the duration on a Saturday ranging from 82 to 97 minutes with the Charlotte store as the outlier with 97 minutes. The other four stores had an average duration of 82 to 87 minutes.
Table 2
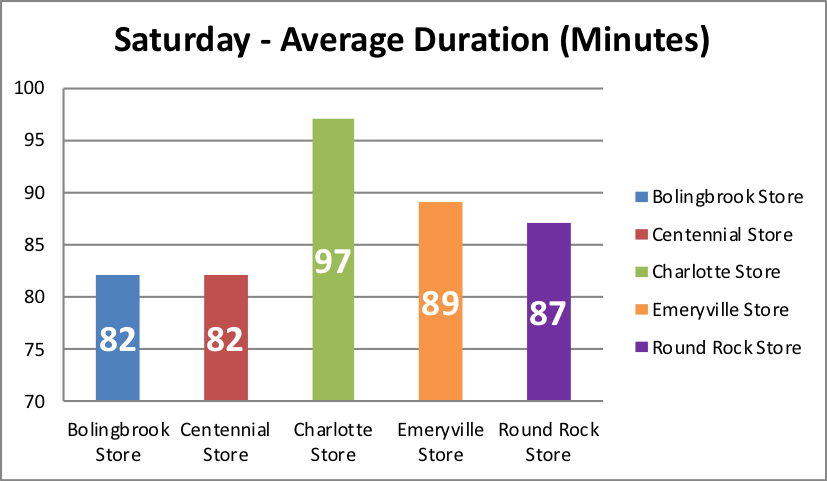
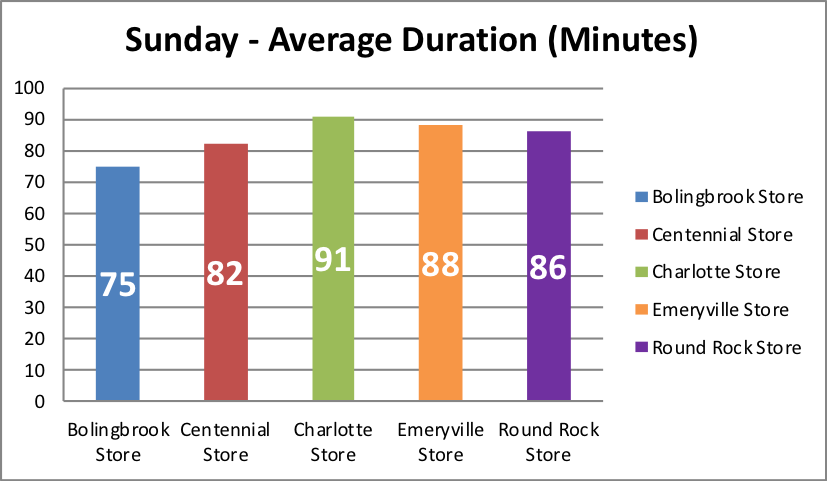
Table 3 is a comparison of the average shopper duration on a Sunday ranging from 75 minutes to 86 minutes.
Table 3
Based on sampling and statistical reliability, we determined that all data collection efforts had achieved a sufficient size sample, both entering vehicles and matched vehicles, to establish a 95% or greater confidence level with a ± 3% sampling error.
Through our data collection effort, we obtained the number of cars that entered the property during each hour at each of the five sites. We received information from the managers at the stores and, as a result, we were able to determine average vehicle occupancy per vehicle.
Table 4
Average Vehicle Occupancy 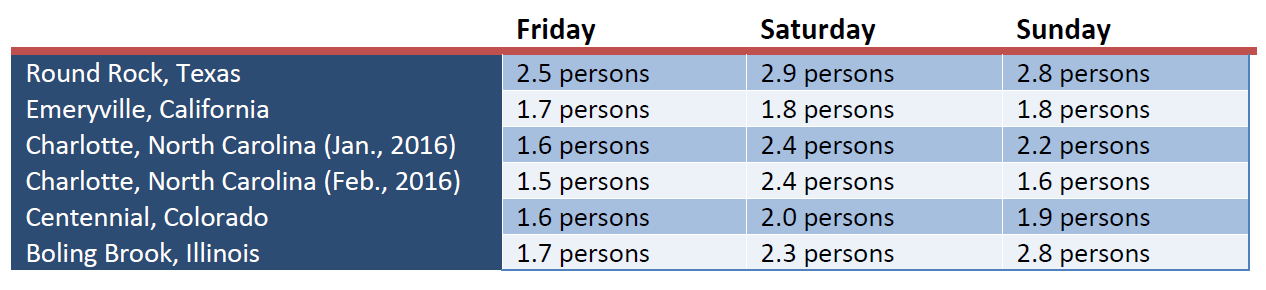
We believe that, based upon all the information we collected and the statistical reliability of the information, this data provides traffic engineers and transportation planners – as well as retailers and developers – with valuable information. Knowing the challenges that brick-and-mortar stores are facing, coupled with the changing transportation and mobility landscape, having data will help all involved make the best decisions on space, size, products, and parking.